Welcome to the Solvice Dashboard
The Solvice Platform Dashboard is your command center for all optimization activities. From here you can create API keys, monitor running jobs, analyze results, and track your usage.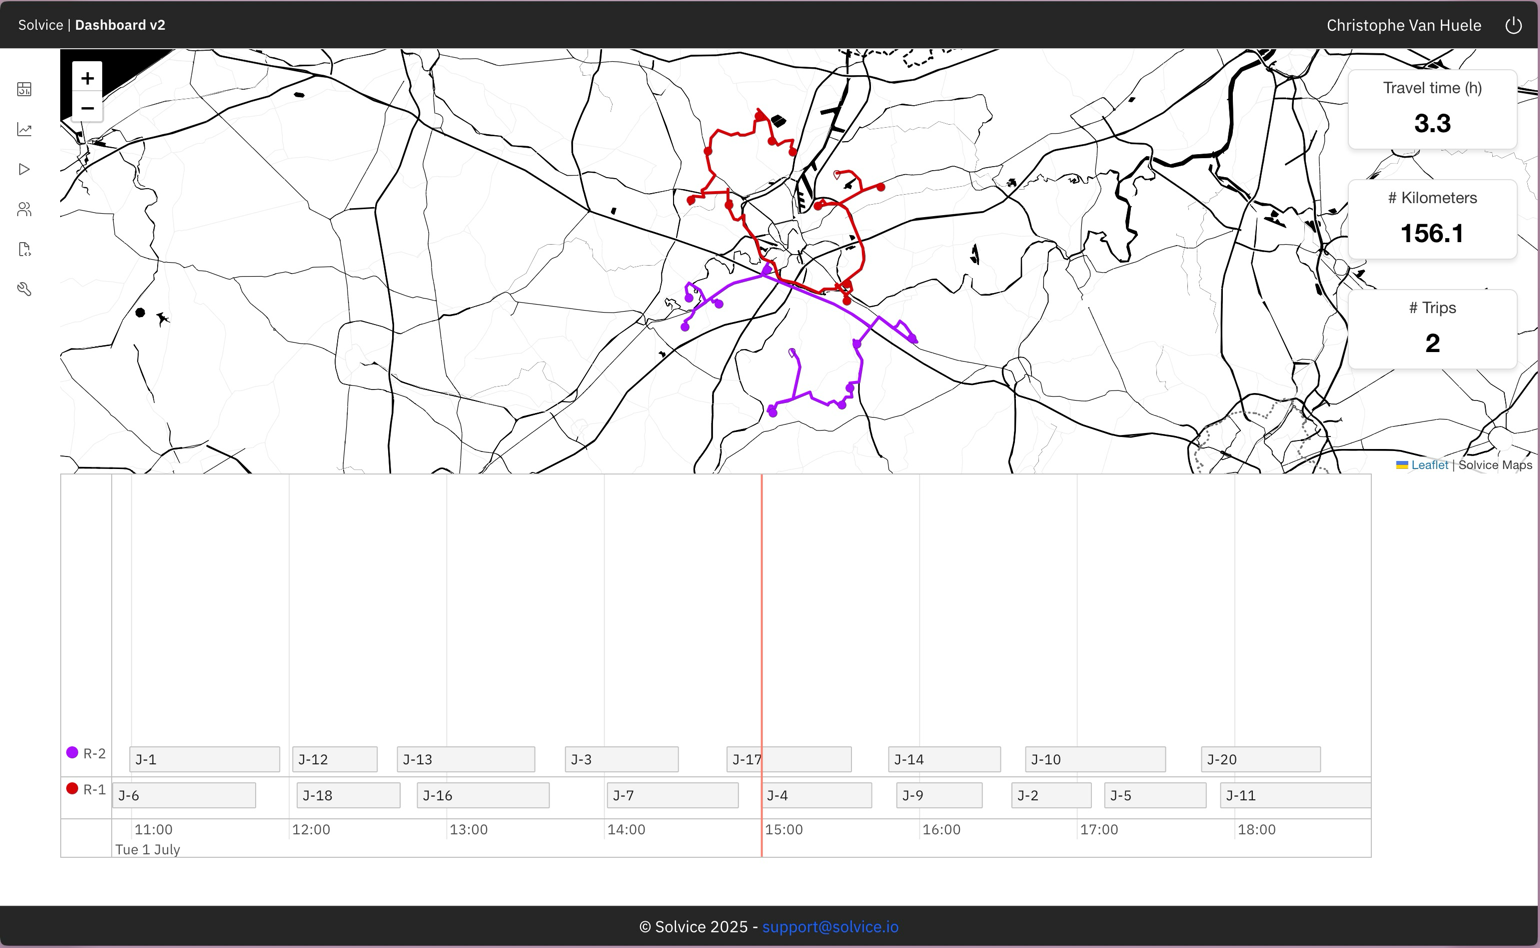
Solvice Dashboard - Your optimization command center
Getting Started
1
Create your account
Visit platform.solvice.io and sign up with your email or SSO provider.
New accounts include a 14-day free trial with full access to all solver capabilities.
2
Explore the dashboard
After logging in, you’ll see the main dashboard with:
- Jobs overview - Recent optimization jobs and their status
- Usage metrics - API calls, solve time, and quota usage
- Quick actions - Fast access to common tasks
3
Create your first API key
Navigate to Settings → API Keys and click Create API Key.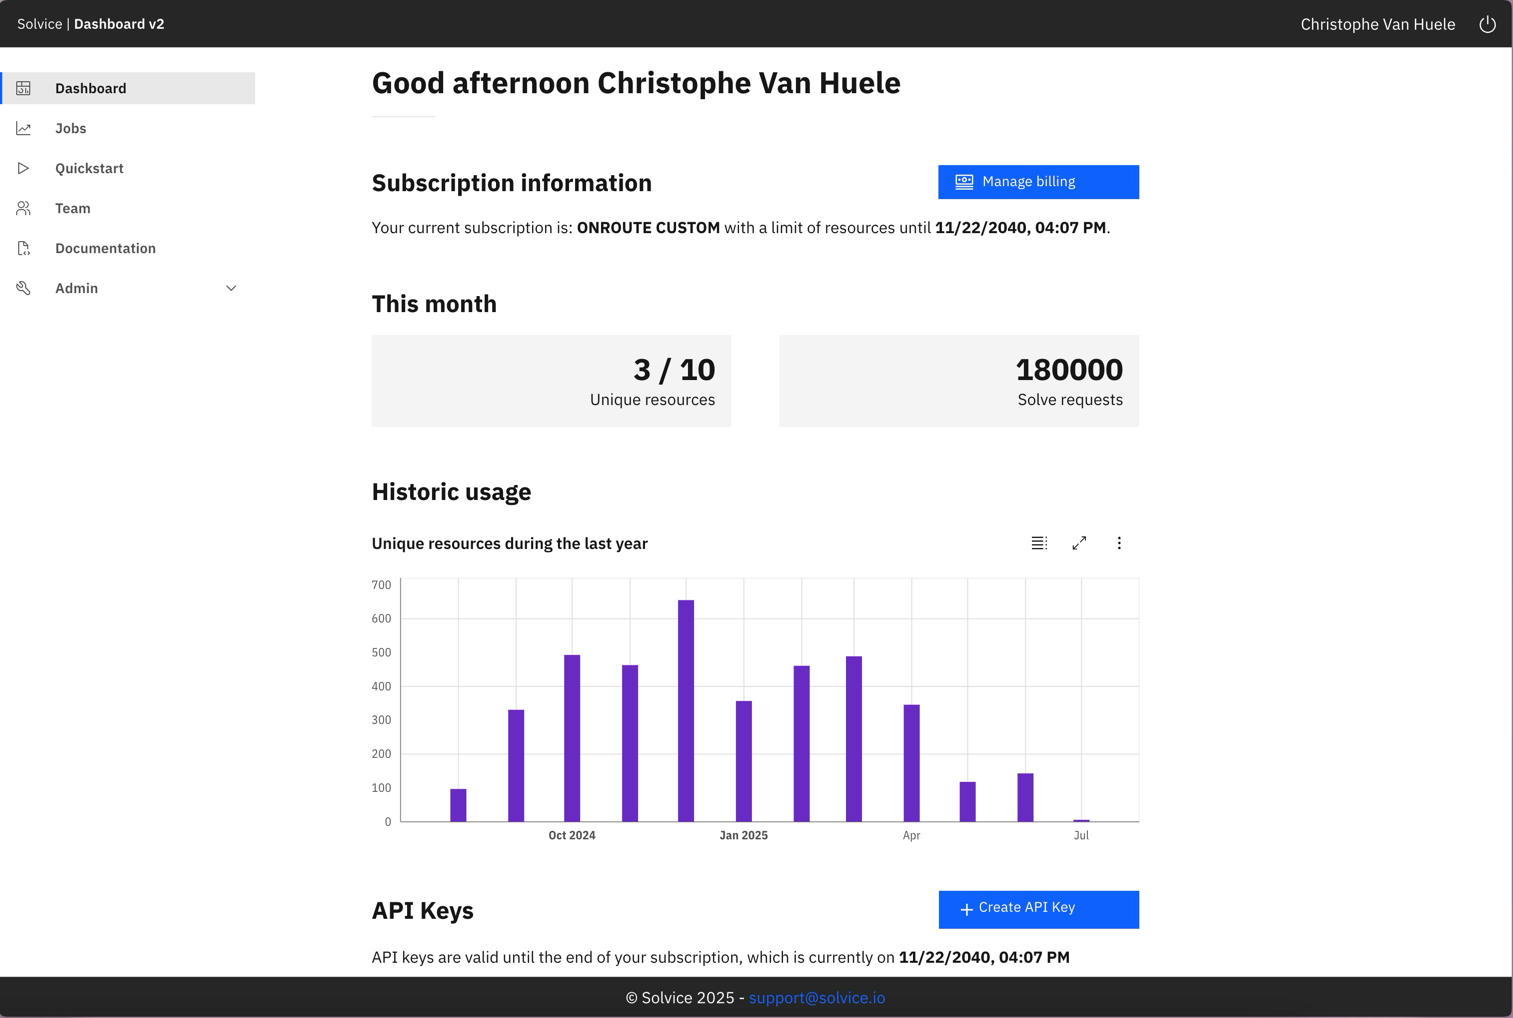
Creating an API key in the dashboard
4
Run your first solve
With your API key ready, submit your first optimization request:
This fetches a demo VRP problem and solves it immediately.
5
Monitor your job
Return to the dashboard to see your job appear in the Jobs section. Click on any job to view:
- Current status and progress
- Solution details once complete
- Constraint explanations
- Performance metrics
Dashboard Sections
- Jobs
- API Keys
- Usage
- Settings
The Jobs section shows all your optimization requests:
Click any job to expand details, view the solution, or download results.
| Column | Description |
|---|---|
| Job ID | Unique identifier for the job |
| Solver | Which solver was used (VRP, Fill, etc.) |
| Status | Current state: QUEUED, SOLVING, SOLVED, ERROR |
| Created | When the job was submitted |
| Duration | Total solve time |
Job Monitoring
The dashboard provides real-time visibility into your optimization jobs.Job Status Flow
Viewing Job Details
Solution View
Solution View
Once a job completes, click to view the optimized solution:
- Score breakdown - Hard and soft constraint scores
- Assignments - Which resources handle which jobs
- Timeline - Visual representation of schedules
- Metrics - Total distance, duration, utilization
Explanation View
Explanation View
Understand why the solver made specific decisions:
- Constraint violations - What couldn’t be satisfied and why
- Trade-offs - How competing objectives were balanced
- Unassigned jobs - Why certain jobs weren’t assigned
Explanations help you refine your input data and constraints for better results.
Request/Response
Request/Response
Access the raw API data:
- Request JSON - The exact input you submitted
- Response JSON - The complete solution output
- Download - Export data for further analysis
Quick Actions
The dashboard provides shortcuts for common tasks:New VRP Job
Jump directly to VRP solver with a template request
New Fill Job
Start a shift filling optimization
View Active Jobs
See all currently running optimizations
Usage Report
Generate a detailed usage report
Keyboard Shortcuts
Navigate the dashboard efficiently:| Shortcut | Action |
|---|---|
G then J | Go to Jobs |
G then K | Go to API Keys |
G then U | Go to Usage |
G then S | Go to Settings |
/ | Open search |
? | Show all shortcuts |